Traffic Attrition Reports is a group of reports that collects problematic queries showing a noticeable drop in traffic or disappearance due to a decline in positions.
There are many possible reasons for a decline in positions. These may be external factors such as the growth of competing sites, seasonality, changes in Google ranking algorithms, etc. However, the reasons often lie in a particular page or website issue. Here are the most common ones:
- Failed changes in text content
- Modified meta tags
- Adding/removing URLs on the page
- Changes in site navigation (e.g., the page was removed from the main menu, the page nesting level changed)
- The page has been removed from the index
The extent of the impact of such changes is not always noticeable. Traffic Attrition Reports solve this issue by displaying the current status of problematic queries compared to the month with the best position. By examining the landing pages corresponding to these queries, you can quickly identify any issues that have emerged since achieving the best position, address them, and regain lost traffic.
Traffic Attrition Reports Metrics
The Report Preview, as described in the ‘Metrics for Audit and Report Preview’ material, displays summary metrics for all three reports in the Traffic Attrition Reports group. Metrics with the same name within each specific report refer only to queries included in that particular report.

Each report contains the following metrics:
Queries in this report — the number of queries affected by the identified problem.
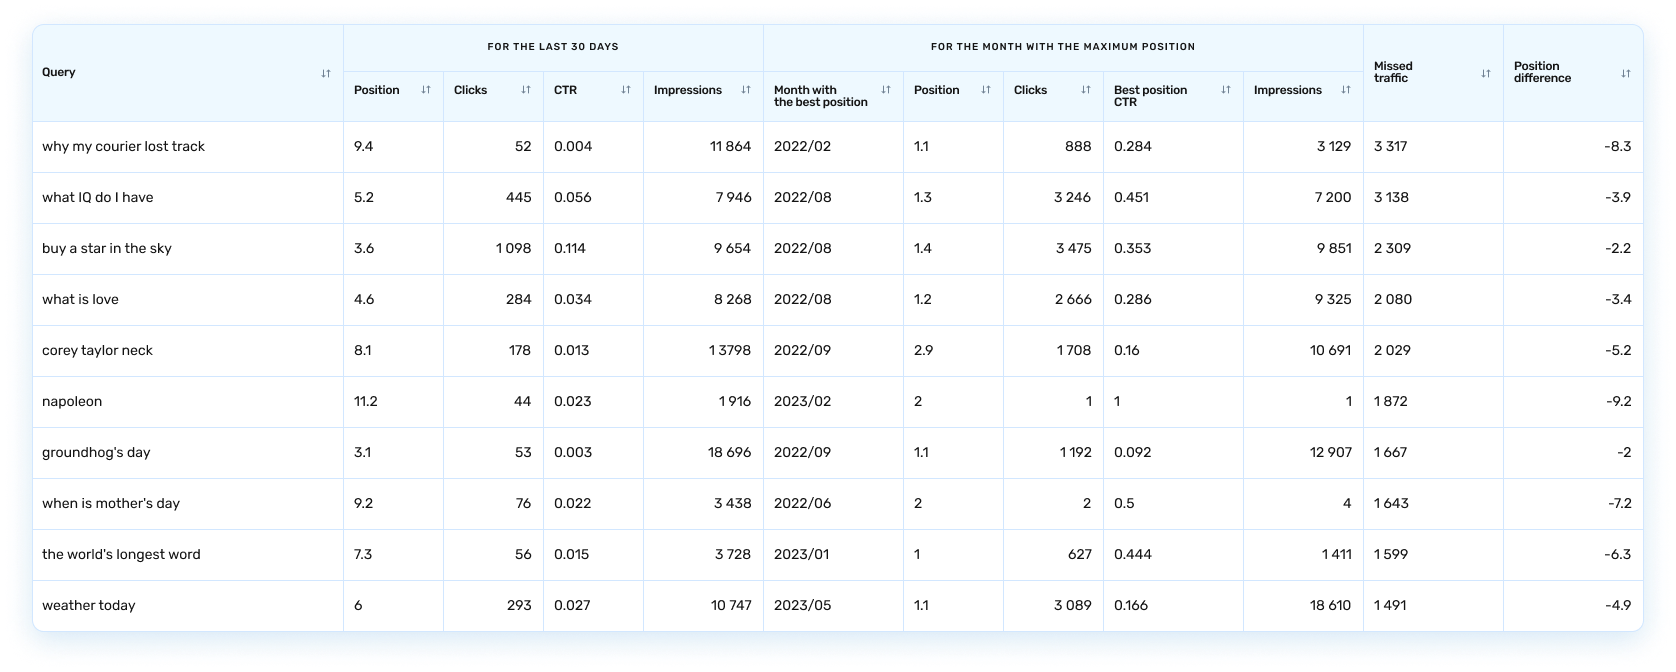
Missed traffic in this group of reports — the total additional traffic that could have occurred over the last 30 days if the situation for each query had been the same as in the best month. The best month for a query is the month with the highest position and the most clicks on that query. This best month is selected from the period within the last 12 months. However, if your site was added to Google Search Console less than a year ago, the period from which the best month is selected will be the same as when the site was tracked in Google Search Console.
The Potential traffic is a percentage representing the share of the total missed traffic for all queries in the report, calculated from clicks in the last 30 days.

Report structure
The Traffic Attrition Reports group consists of three reports:
High-volume declined keywords
Queries that previously ranked higher and delivered regular traffic have recently lost positions and provide less organic traffic than before. This is the traffic you are losing right now. Yes, the situation with these queries is not yet critical: there is traffic, and there are positions. However, first of all, we recommend processing the queries identified exactly in this report as it’s often easier to fix the problem at this stage, preventing further traffic losses with minimal effort and potentially regaining better positions.
Lost keywords
Queries that previously led to higher rankings and consistently brought traffic to your website no longer generate traffic. Thus, in this report, in the “For the last 30 days” block, the Clicks and CTR columns will always contain the value 0.
Unstable keywords
Queries by which your website is unstable while generating traffic.
Queries with/without impressions
In the Lost keywords and Unstable keywords reports, queries are divided into two tabs.

Queries with impressions — there were impressions, but there were no clicks. The Queries without impressions tab is the most problematic group of queries for which there were neither impressions nor clicks. What could cause this situation to occur?
- A significant decrease in the relevance of the page to the query
- The relevant page has been deleted or dropped from the index
Also, the Queries without impressions tabs contain queries that are no longer relevant, for example, due to seasonality. Of course, such queries will not need elaboration. We do not determine which query is relevant and has lost clicks and impressions due to some problem and which query has already lost its relevance – only you can do this here. To avoid distorting the forecast of potential traffic, we do not count Missed traffic for queries on the Queries without impressions tabs and do not include statistics on these queries in the calculation of All missed traffic and All potential traffic.
How data is organized in tables
Query data is segmented into two blocks: “For the last 30 days” and “For the month with the maximum position”. Missed traffic and Position difference are displayed in separate columns, unavailable on the Queries without impressions tab.

By default, queries in all sections and tabs of Traffic Attrition Reports are sorted by the amount of lost traffic, from highest to lowest.
If needed, you can sort the data by the values of any column. To do this, click the sort button in the header of the desired column. The table will then be arranged by the values in the selected column, from the smallest to the largest. Click the button again to sort from largest to smallest. The column by which sorting is applied will be highlighted in gray.

The current implementation does not support complex sorting by several columns simultaneously, data search, or filtering. If necessary, you can download reports in Excel format and perform the required data processing using the appropriate program.