The Easy to Rank Keywords Report shows how well the text content on your site is optimized for relevant queries. This report will help you understand how to increase in organic traffic by optimizing text content for the most promising keywords.
In this report, we do not check all the pages of your site; Only those pages that Google considers relevant for those queries that bring a significant share of traffic to your site are analyzed. To put it simply, the report works as follows:
- The query pool that contributes a significant portion of traffic to your website is identified from all queries,
- For each query, a corresponding targeted page is determined,
- The accessibility of the targeted page is checked, and text content is analyzed,
- For all analyzed queries, KeyRel by query is calculated (KeyRel is an abbreviation for keyword relevance),
- Based on the entire volume of analyzed queries, a weighted average value is determined — Weighted KeyRel, which reflects the degree of optimization of the site as a whole,
- The final report includes only problematic queries that require elaboration of landing pages, i.e., only queries with an insufficiently high KeyRel by query; queries with high KeyRel are not included in the report — we only use them to calculate Weighted KeyRel.
This report will, among other things, assist in identifying missed semantics by displaying queries for which your site is already ranking in Google despite the absence of relevant keywords on your site’s pages – such queries will have minimum KeyRel values.The Easy to Rank Keywords Report metrics are described below. Go to the product page to learn more about the internal logic of this report.
Easy to Rank Keywords Report Metrics

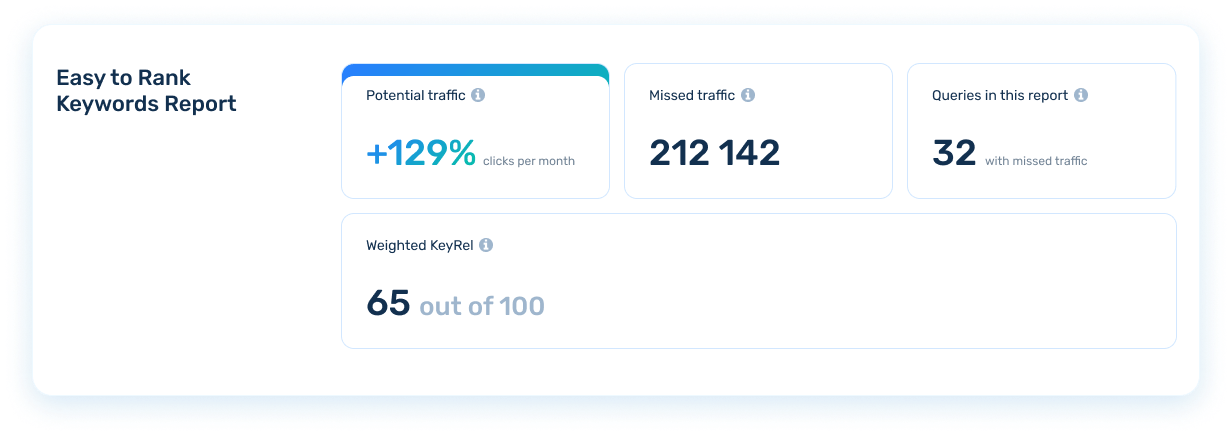
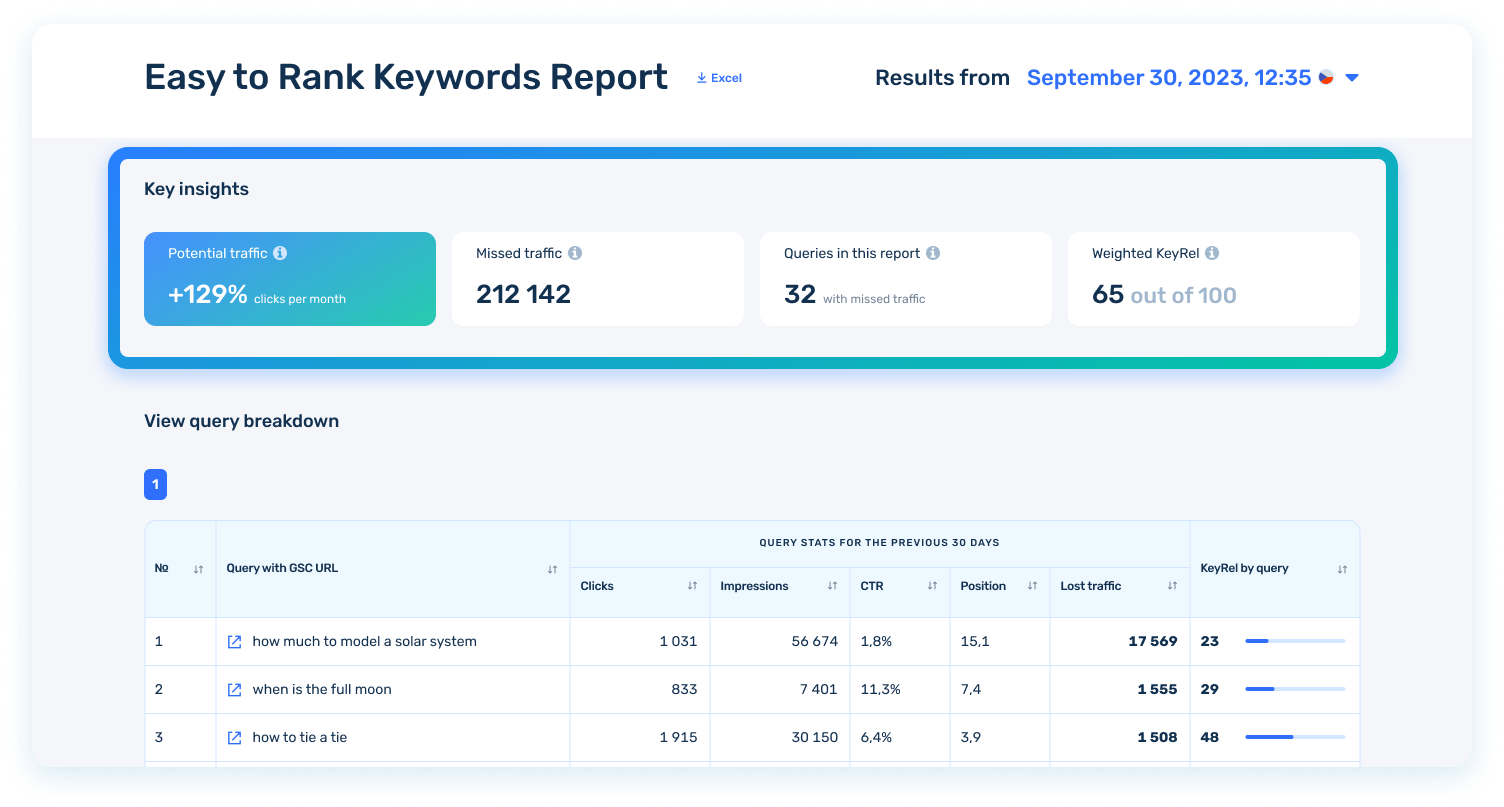
The preview displays the following metrics:
Queries in this report — the number of problematic queries included in the report, i.e. the number of queries whose landing pages have a low KeyRel by query value and need text content optimization.
Weighted KeyRel — this metric answers how broadly the text content on the site is optimized for the queries that most frequently bring users to the site. It has a value ranging from 0 to 100 points and is the weighted average of all KeyRel by query values in the report.
Missed traffic inside this report — how much additional traffic could have been generated in the last 30 days if the site for this query was in the top 3 with an average CTR. The average here represents your site’s CTR for all queries for which it is already ranked in the top 3. Missed traffic is displayed for each query within the report, and the report preview displays the total value of Missed traffic for all queries in the report.
Potential traffic — the percentage of the total Missed traffic of every query in the report based on Clicks in the Last 30 Days.

How data is organized in a table
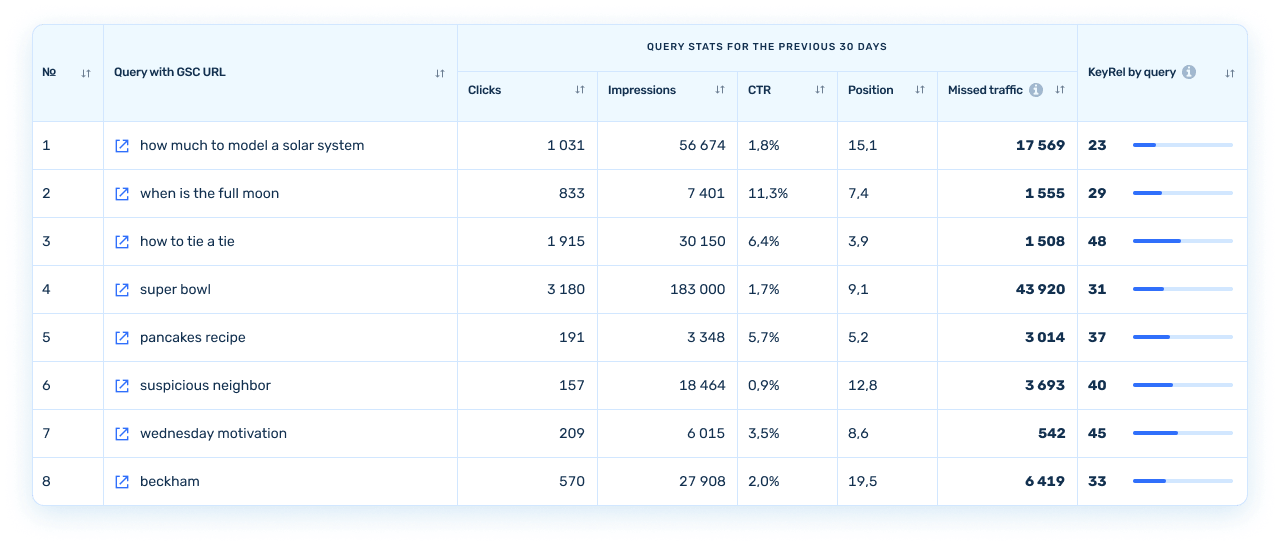
The report includes a list of queries with links to Google Search Console, statistics for the last 30 days, and the KeyRel by query. This metric demonstrates a site’s degree of relevance to a query, answering how well the text content on the site’s landing page, i.e., the page that receives most of the traffic for this query, is optimized. The KeyRel by query metric ranges from 0 to 100 points.

Click on the link icon next to the query to determine which page is the target page. Google Search Console will open in a new tab with information on this query, displaying the pages to which the query was made — in most cases, this will be one page, but it might be several.

Optimize your target pages for the query by adding relevant keywords and get more traffic 🙂
Queries in the report are numbered according to the perspective elaboration. First, there are queries for which you can get the most significant traffic boost with the least amount of work; these are queries whose landing pages are already receiving a good amount of traffic but can receive even more with minor modifications.
Therefore, we suggest sticking to the report’s numbering order when developing website pages for queries.
If required, you can arrange the data according to the values of any column. To do this, click the sort button located in the desired column’s header.

The table will then be sorted according to the values in the selected column, starting with the lowest value and working your way up to the highest. If you want to sort from largest to smallest, click the button again. The gray highlighted column is the one that will be used for sorting.
The current implementation does not include data search, filtering, and complex multi-column sorting. If necessary, you can download reports in Excel format and process the data required in the appropriate program.